ASSESSING AND OPTIMIZING GENOTYPE IMPUTATION STRATEGIES IN PACIFIC OYSTER Crassostrea gigas
Introduction
Genomic selection uses genome-wide SNP genotypes to predict breeding values, and this methodology has been widely applied in terrestrial livestock and several aquaculture species, conferring cumulative improvements in a wide range of economically important production, health and welfare traits. The development of a medium-density SNP array for Pacific and European Oysters (Gutierrez et al., 2017), and the publication of a chromosome-level reference genome assembly , have opened new promising avenues for the design of effective genomic selection strategies in these species. However, the capacity to routinely genotype at high density (HD) large numbers of individuals, as is required for genomic selection, remains prohibitively expensive for much of the sector. In previous studies in Atlantic salmon, genotype imputation has been proposed as a cost-effective method to implement genomic selection in breeding programmes (Tsairidou et al., 2020, Tsai et al., 2017) . I mputation allows prediction of HD genotypes from low density (LD) SNP panels, by using information from haplotypes shared between related individuals. Hence it requires dense genotyping only for a subset of the population, thereby substantially reducing the genotyping costs. T he aim of this study was to test and assess genotype imputation for genomic prediction in Pacific oyster, using two different imputation software, and data for survival to the ostreid herpesvirus OsHV-1 , a trait known to have a polygenic genetic architecture and hence being suitable for genomic selection (Gutierrez et al., 2020, Gutierrez et al., 2018)
.
Materials and Methods
Our study focused on a commercial breeding programme population challenged with the ostreid herpesvirus OsHV-1 (Cawthron Institute, New Zealand). Binary survival data recorded at the end of the trial and continuous time-to-death data were available for 718 individuals . All individuals, including their parents, were genotyped using the Affymetrix SNP array for oysters (Gutierrez et al., 2017)
(25,600 SNPs). A fter mapping to the latest reference genome
and performing quality control, 13,763 SNPs and 743 individuals (699 offspring and 44 parents) were retained for subsequent analyses. The analysis comprised three main parts: (a) heritability and genomic prediction analyses for the HD directly genotyped data; (b) generating a range of LD SNP panels from the HD data, and testing their genomic prediction accuracy; and, (c) imputing the LD SNP panels to HD to assess their imputation accuracy, and estimate genomic prediction accuracy using HD imputed data.
Genomic prediction was assessed via 20 repeats of 5-fold cross-validation, to estimate the mean prediction accuracy from the correlation between predicted breeding values (BVs) and phenotypes, corrected for the trait heritability. T he BVs were estimated in ASReml /3.0 using the following generalized linear mixed animal model which implements the logit link function for the binary survival data:
Tank was fitted as a fixed effect in b , and genetic relationships between individuals were fitted as random effects through the genomic relationship matrix G calculated from SNP data with ~ N(0, ). Heritability estimates were adjusted to the underlying liability scale. Time-to-death was analysed using a linear model. Low density in silico SNP panels were constructed via random sampling of SNPs within each chromosome but proportionally to chromosome length. Genotype imputation was performed using (a) AlphaImpute v2
(Whalen and Hickey, 2020, Hickey et al., 2011)
, and (b) FImpute v3.0 software
. A range of imputation scenarios were tested where the majority of offspring were genotyped at LD for densities ranging between 100 and 10,000 SNPs, and parents were genotyped at HD .
Results and Discussion
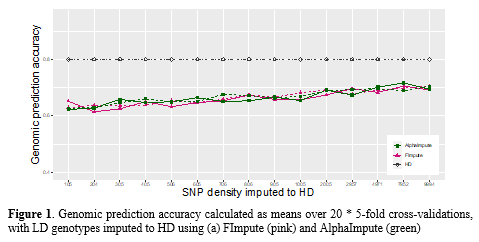
The heritability estimated using the genomic relationship matrix calculated from HD SNP genotypes was 0.39 (s.e. 0.05) for survival and 0.64 (s.e. 0.05) for time-to-death. The mean genomic prediction accuracy over 20 replications of 5-fold cross validation was 0.80 (s.d. 0.02) for survival and 0.73 (s.d. 0.02) for time-to-death . Reducing the SNP panel density from HD to 1 00 SNPs resulted in ~ 31 % decrease of the genomic prediction accuracy for both survival and time-to-death. Imputation accuracy increased with increasing density of LD SNP panels imputed to HD, and overall, FImpute provided higher imputation accuracies than AlphaImpute in this data, although this difference was not statistically significant. Genomic prediction accuracies using imputed genotypes increased for higher densities imputed to HD, likely reflecting the better imputation accuracy for higher densities. Prediction accuracy was not found to differ significantly between genotypes obtained through using different imputation software (Figure 1). When using imputed genotypes, the prediction accuracies were found to be inferior to those obtained from directly genotyped HD data, regardless the software used for imputation.
While pedigree data can be used to predict breeding values only at the between-family level, in this study, genomic prediction was performed using the genomic relationship matrix calculated from imputed and directly genotyped data, which captures both between- and within-family variation . Further analyses are underway to test alternative scenarios of constructing the LD and HD groups , and to assess their impact on imputation and genomic prediction accuracy .
References
1. Gutierrez, A. P. et al. (2017) G3 (Bethesda) 7, 2209-2218. 2. Peñaloza, C. et al. (2021) GigaScience 10. 3. Tsairidou, S. et al. (2020) G3: Genes|Genomes|Genetics 10, 581-590. 4. Tsai, H.-Y. et al. (2017) G3: Genes|Genomes|Genetics 7, 1377-1383. 5. Li, Y. et al. (2009) Annu Rev Genomics Hum Genet 10:, 387-406. 6. Gutierrez, A. P. et al. (2020) Anim. Genet. 51, 249-257. 7. Gutierrez, A. P. et al. (2018) G3: Genes|Genomes|Genetics 8, 1273-1280. 8. Gilmour, A. et al. (2009) ASReml User Guide Release 3.0. 9. Whalen, A., J. M. Hickey (2020) bioRxiv, 2020.2009.2016.299677. 10. Hickey, J. M. et al. (2011) Genet. Sel. Evol. 43, 1297-9686. 11. Sargolzaei, M. et al. (2014) BMC Genomics 15, 478.