SELECTIVE GENOTYPING STRATEGIES FOR GENOMIC SELECTION FOR A DISEASE RESISTANCE TRAIT
Introduction
Genomic selection can increase genetic gain in aquaculture breeding for many traits, especially for traits which are not measured on the candidates themselves such as disease resistance traits. However, its implementation in this industry has been challenged by staggering genotyping cost due to many individuals needed to genotype. The aim of this study was to examine the potential of selective genotyping of reference population for genomic selection for a sib-evaluated binary trait using in silico approach.
Materials and Methods
Survival data from 7,298 belonging to 348 full-sib families from MOWI population challenged with salmonoid alphavirus (SAV3) were available. study Families with family size of greater than 20 were selected (there were 225 families). All individuals were genotyped with the customized NOFSAL3 ~55k SNP. Even though, genotype data for all individuals were available, for this study the genotypes of a varying fraction of reference sibs were masked according to the selective genotyping strategy.
There were five selective genotyping strategies tested: 1) Full Genotyping (FG): Genotyping all training sibs. 2) Top-Bottom Genotyping (TBG): genotyping of 10 training sibs per family, aiming at 5 dead and 5 live sibs. For families with less than 5 sibs of one category, additional sibs of the other category were genotyped. 3) Minor Category Genotyping (MCG): selective genotyping of sibs with the least common (i.e., minor) binary category phenotype. 4) Random Across family genotyping (RAG): genotyping of randomly selected sibs across families. 5) Random Within family Genotyping (RWG): genotyping of 10 random sibs per family regardless of their phenotype. The average number of training sibs to genotype by the different genotyping strategies were FG = 4,055, TBG = 2,250, MCG = 745, RAG = 2,250 and RWG = 2250. The number of genotyped individuals in MCG strategy was low due to there are many families with mortality rate higher than 90%.
The performance of three were tested, that is, Best Linear Unbiased Predictions of breeding values using pedigree-based relationships (PBLUP), genomic relationships for genotyped individuals only (GBLUP) and a single-step approach (ssGBLUP) using both pedigree and genomic. were estimated using BLUPF90 (Misztal et al., 2018) by fitting the following mixed linear model:
where>/p>is a vector of phenotypes coded as 0 and 1 for dead and survived fish respectively, is a vector of fixed effect of the sex (2 levels), is a vector of breeding values, is a vector of random residual effects and are incidence matrices. It is assumed that and , where are genomic, combination of pedigree and genomic, and pedigree-based relationship matrices respectively, is additive genetic variance and is random residual variance.
Prediction accuracy and the bias of the prediction models were assessed based on 100 replication of a cross-validation scheme. In the cross-validation, the phenotypes of 20% of individuals from each family were masked and their breeding values were estimated using the genotypes and phenotypes of the reference population. The accuracy was computed as the correlation between the estimated breeding value (pedigree/genomic, PEBV/GEBV) with the phenotype and scaled by the square root of heritability of the trait (0.32). The bias was computed as the regression coefficient of phenotypes on either PEBV or GEBV. A regression coefficient that deviates from unity indicates either inflation or deflation of the breeding values. The means and standard errors for the prediction accuracy and biases were calculated from the 100 replications.
Results and Discussion
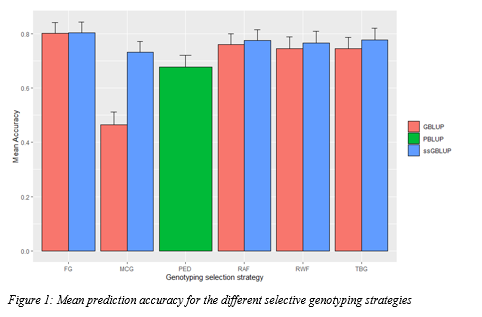
Prediction accuracies for the different selective genotyping strategies are shown in Figure 1. As expected from the large family sizes, the average prediction accuracy for the classical family-based evaluation (i.e., PBLUP) was moderate, 0.67. The prediction accuracies for the different genotyping selection strategies were between 0.46 - 0.80 when standard GBLUP is used, and between 0.73 - 0.81 when ssGBLUP is implemented (Figure 1). Genomic models, except MCG with GBLUP, were found to increase prediction accuracies compared to PBLUP. For all the selection strategies, the prediction accuracy of ssGBLUP models were higher than the respective GBLUP models (Figure 1). This is because the ssGBLUP models use all the phenotype information by combing data from genotyped and ungenotyped individuals (Legarra et al., 2009). When applying ssGBLUP, the loss of prediction accuracy by genotyping a fraction of test sibs was limited for RAF, RWF and TBG approaches.
The prediction bias was lowest with the FG, RAG and RWG for both GBLUP and ssGBLUP models, while MCG and TGB strategies resulted in deflated GEBV. The results showed that selective genotyping strategies in combination with ssGBLUP approach could be used to minimize genotyping cost without compromising genomic prediction accuracy significantly.
References
Legarra, A., Aguilar, I., and Misztal, I. (2009). A relationship matrix including full pedigree and genomic information. J. Dairy Sci. 92, 4656–4663.
Misztal, I., S. Tsuruta, D. A. L. Lourenco, Y. Masuda, I. Aguilar, A. Legarra, Z. Vitezica (2018). Manual for BLUPF90 family programs. University of Georgia