THE FINS MODEL – A WEB-BASED FRAMEWORK FOR AQUACULTURE SUSTAINABILITY
Introduction
The supply of aquatic products for human food predominantly relies on aquaculture, which is now 57% of global production (FAO, 2024). In recent years, annual growth has been 6.6%, but in the West growth has been considerably slower or flatlined.
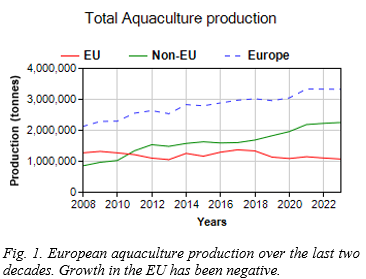
Fig. 1 shows that growth in Europe (data from Eurostat: http://meta.longline.co.uk) was mainly driven by Norway (salmon) and Turkey (bass and bream). Even if the UK is excluded due to Brexit, the EU APR for the period is -0.1%, compared with 7.9% for non-EU European nations (9% if the UK is excluded from the calculations).
North America is in a similar situation, with a 2008-2022 APR of 0.5% for Canada and 2.3% for the USA. The total production for Europe and North America in 2022 is 4.2 million tonnes, 3% of world production, for 12% of the world population. In Europe, demand for seafood has remained constant, with 22.2 kg per capita y-1 in both 2007 and 2024 (FAO, 2010; FAO, 2024) but in Asia, the demand increased from 18.5 kg per capita y-1 in 2007 (FAO, 2010) to 24.7 kg per capita y-1 in 2024 (FAO, 2024). These numbers are very significant because (i) per capita consumption in Asia is now 11% higher than in Europe, reflecting the increase in Asian per capita GDP; and (ii) Due to the combination of population ratio (Asia : Europe = 6.5) and per capita consumption difference, Asia annually consumes 119 Mt of aquatic products and Europe consumes only 16 Mt. This huge and widening gap, allied to the fact that 90% of aquaculture production occurs in Asia, means that Europe and North America face a critical problem with respect to the supply of aquatic products—and therefore food security for the coming generations.
Whereas in Asia, freshwater aquaculture in ponds and lakes makes up 70% of production, in the West, cultivation is mainly in coastal bays and estuaries. This means that Marine Spatial Planning (MSP) plays a key role in harmonising multiple uses through appropriate allocation of space (Strand et al, 2025) but MSP determines the effect of the environment on aquaculture—imposing constraints on where the activity can occur; MSP does not address the effect of aquaculture on the environment: other types of mathematical models are required to address this (Ferreira, 2025).
These models are extensively published in the literature and have been applied in various parts of the world, but there is a need for frameworks that bring together complex models to deal with issues such as sediment organic enrichment and pathogen outbreaks, that occur at very different time and space scales.
Methods
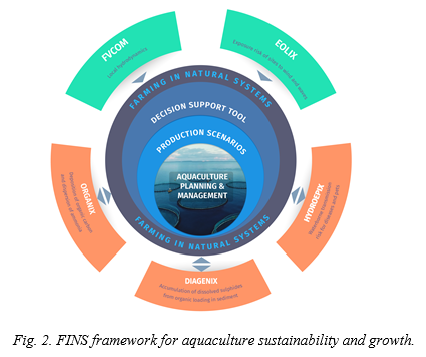
The FINS (Farming In Natural Systems) framework (Fig. 2) combines a set of models that address specific issues related to finfish and shellfish aquaculture.
These include near-field deposition and fate (diagenesis) of particulate organics, far-field nutrient enrichment, using ammonia as an indicator, together with oxygen reduction, and for bivalves, chlorophyll (as a proxy for food) depletion. Detailed models for water circulation are the base for understanding the distribution of key performance indicators (KPI) of aquaculture sustainability.
Associated with these circulation models are well-tested physiological models for growth of finfish and shellfish species such as salmon, bass, bream, oysters, and mussels. FINS is fully georeferenced and can represent multiple types of aquaculture structures within a bay, including cages, cage grids, rafts, and longlines—the location, type, and dimensions of structures are user-defined.
Results and Discussion
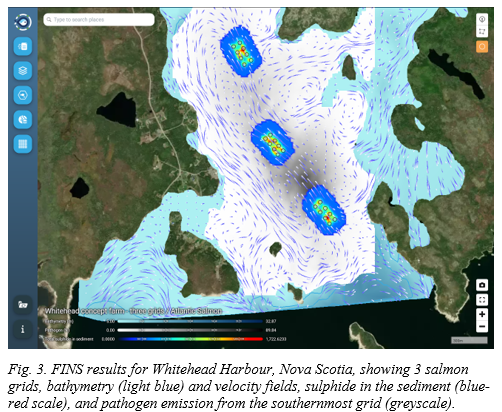
The results presented in this paper illustrate the outputs of FINS for different KPI in selected bays in Nova Scotia, Canada. Fig. 3 shows four (concept) layers for Whitehead Harbour, Nova Scotia: the bathymetry and residual velocity (from the FVCOM model) for the entire bay and three user-defined grids of eight 30 m diameter salmon cages; outputs of three models (circulation, diagenesis, and pathogen emission) show the effects of salmon cultivation through a 500-day cycle.
The near-field deposition of particulate organics from uneaten and waste feed is simulated, together with the consequences for sediment diagenesis, in this case for sediment sulphide concentration; far-field dispersal of a pathogen emitted from the southernmost grid is also shown—the residual currents transport the pathogen NW leading to infection in the central and northern grids. This allows managers to examine the interaction between existing or potential farms with respect to disease connectivity, promoting improved animal welfare, natural biodiversity, and ecosystem sustainability.
FINS allows for models external to the application to be displayed, including GeoJSON outputs from Geographical Information Systems. This helps to take spatial planning to the next level. By applying different mathematical models to aquaculture structures placed in suitable areas and examining e.g. the potential effect of pathogen dispersal or eutrophication in adjacent zones, MSP can be leveraged to account for the dynamic nature of coastal ecosystems.
FINS also represents a major technological advance in a platform of this type when compared to conventional desktop solutions. FINS runs in the browser, like any website, and users can access and use it anywhere, from any computer or tablet—even on TV. In a world that increasingly relies on the Internet of Things (IoT), this is a critical advantage. The option to use the GPU for the graphics primitives in FINS, including design of any type of polygon as an aquaculture structure, animation of residual current flows, and various other features, has led to very significant improvements in speed and functionality.
Acknowledgements
The authors wish to acknowledge funding from the Atlantic Fisheries Fund, Canada and the Horizon Europe NovaFoodies project. We also owe a profound debt of gratitude to the late Prof. Jon Grant, a huge enthusiast of the FINS project.
Key references
Chen, C. H. Liu, R. C. Beardsley, 2002. An unstructured, finite-volume, three-dimensional, primitive equation ocean model: application to coastal ocean and estuaries. Journal of Atmospheric and Oceanic Technology,20, 159-186.
Cubillo, A.M., J.G. Ferreira, S.M.C. Robinson, C.M. Pearce, R.A. Corner, J. Johansen, 2016. Role of deposit feeders in integrated multi-trophic aquaculture - a model analysis. Aquaculture, 453, 54-66.ntegrated multi-trophic aquaculture - a
DFO, viewed January 2025. https://www.dfo-mpo.gc.ca/stats/aqua/aqua-prod-eng.htm
FAO (Food and Agriculture Organization of the United Nations), 2010. The state of world fisheries and aquaculture (SOFIA). FAO, Rome, 218 pp.
FAO (Food and Agriculture Organization of the United Nations), 2024. The state of world fisheries and aquaculture (SOFIA). FAO, Rome, 264 pp.
Ferreira, J.G., 2025. Aquaculture carrying capacity estimates show that major African lakes and marine waters could sustainably produce 10-11 Mt of fish per year. Nature Food, https://doi.org/10.1038/s43016-025-01114-1
Ferreira, J.G., Taylor, N.G.H., Cubillo, A., Lencart-Silva, J., Pastres, R., Bergh, Ø., Guilder, J., 2021. An integrated model for aquaculture production, pathogen interaction, and environmental effects. Aquaculture 536, 1-16, doi.org/10.1016/j.aquaculture.2021.736438
NOAA Fisheries, viewed January 2025. https://www.fisheries.noaa.gov/about/office-science-and-technology
Trading Economics, viewed January 2025. https://tradingeconomics.com/united-states/aquaculture-production-metric-tons-wb-data.html
Strand, Ø, Liu, H., Ferreira, J.G., Filgueira, R., Grefsrud, E.S., Kupka Hansen, P., Sun, Q., Weitzman, J., 2025. Perspectives on mariculture implementation in maritime spatial planning frameworks and contributions to global food security. Reviews in Aquaculture, in press.