SHELLFISH REGULATORY ECOSYSTEM SERVICES – POTENTIAL FOR NUTRIENT CREDIT TRADING
Introduction
Nutrient- related water quality degradation is a global challenge to coastal waterbody health. B ivalve aquaculture can help reduce impacts of eutrophication through filtration, which removes particulate organic material (POM). Some filtered POM is assimilate d into tissue and shell, and rest is expelled as faeces, pseudofaeces and ammonia. The potential contribution of bivalve aquaculture to reduction of nutrient impacts in European (EU) coastal waters was evaluated to develop a framework for nutrient credit trading in the EU that will include bivalve shellfish producers. An economic valuation of the removed nutrients was also made to show the value within the larger context of the shellfish industry and nutrient management, and to show the potential compensation that might be paid to shellfish producers for the nutrient removal service provided, if they were included in a nutrient credit trading program.
Methods
Nutrient Loads : Data for nutrient loads to Regional EU Seas were compiled , updating a previous evaluation (Ferreira and Bricker, 2016) . Sources included: (i ) Skarbøvik et al. (2013 ) for Norwegian and Barents Seas; (ii) HELCOM (2015, 2018) for the Baltic Sea; (iii) OSPAR (2017) for the Greater North Sea, Celtic Seas and Bay of Biscay; and (iv) Bouraoui et al. (2011) for Greater North, Black, and Mediterranean (Med) Seas.
Shellfish production and associated nutrient removal : Bivalve production data for b lue mussel, Med mussel, Pacific oyster, European oyster, and Manila clam were sourced from META
and Eurostat
websites. Net nutrient removal was estimated in two ways : (i) through elemental analysis of shellfish flesh and shell for each species which was then scaled to production , and (ii) by application of the Farm Aquaculture Resource Management (FARM) model. The model calculates nutrient removal and potential economic value, providing a substitution or ‘avoided’ cost of land-based nutrient removal that would serve as additional revenue to the farmer in a nutrient credit trading program (Cornwell et al. 2016; Ferreira and Bricker 2016; Bricker et al. 2018).
Scaling nitrogen removal to country and European scale: Nitrogen (N) removal estimates were ups caled to estimate bioextraction potential and associated economic value for the regulatory ecosystem service provided by each shellfish species at country and EU level. T otal N removal by shellfish aquaculture was compared to total N load to EU Seas.
Results and Discussion
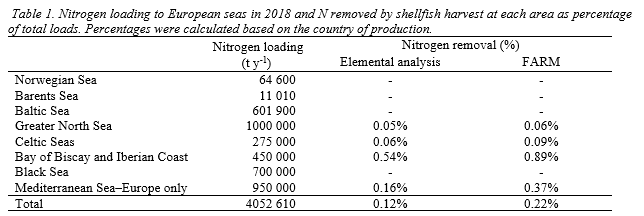
Nutrient Loads : The total N load to EU seas was 4777 × 103 tonnes (t) y -1 (Table 1). The Greater North Sea (1500 × 103 t y-1 ), Med Sea (950 × 103 t y-1 ) and Baltic Sea (826 × 103 t y-1) received the highest loads, while the Arctic region received the lowest: Norwegian Sea (65 × 103 t y-1 ) and Barents Sea (11 × 103 t y-1).
Shellfish production and associated nutrient removal : The five species selected for this study accounted for > 95% of total EU farmed shellfish production and 40- 45% of all farmed aquatic organisms (Eurostat, 2020). The largest EU producers we re Spain and France. Spanish bivalve production was 42% of EU output, dominated by Med mussel , while France accounted for 24% of EU farmed bivalves with Pacific oysters as the main species (65% in 2018), followed by blue mussels (31%).
Scaling nitrogen removal to country and European scale: The total estimated N removed by farmed bivalves in EU Seas wa s 8.9 × 10³ t y -1 and 4.9 × 10³ t y -1 by the FARM model and elemental analysis, respectively. Comparison of removal estimates by the two approaches shows that FARM model results were higher for all species except blue mussel culture for which estimates showed good agreement. B oth approaches showed the bulk of N removed wa s attributed to Med mussel aquaculture (between 61 and 68%) . Pacific oysters were the second largest contributor to N removal , 8.0-15% of total, depending on approach. Spain wa s the primary contributor to N removal due to high production of Med mussels, accounting for 45-49% of total removal depending on the approach. Italy and France each account for 15-20% of total N removal. The elemental analysis approach showed Med and blue mussels had the highest capacity for N removal, reaching ~ 9-10 t of N removed per 1000 t harvested. Oysters and Manila clams ranged from 2.9- 3.7 t of N removed per 1000 t harvested. The modelling approach showed that Manila clams have greatest removal capacity followed by flat oyster and Med mussel, which had similar removal.
S hellfish production in the EU removed between 0.12 % (elemental ) and 0.22% (FARM) of total 2018 N inputs to European Seas (
). This varies by waterbody; N removal in the Greater North Sea is ~ 0.05% of inputs, while in the Bay of Biscay and Iberian coast it was as high as 0.89% due mostly to Med mussel production. While this seems small, the estimated avoide d cost value of removed N, using the Virginia Chesapeake Bay Nutrient Credit Exchange Association value of US$8.33 (6.89€) per credit, is 34-61 million € or ~3-6% of the total production value (974 million €). This could be compensation to growers if they were included in a nutrient credit trading program. If shellfish growers are not included, this valuation could still enhance public awareness of water quality issues, and could help shift attitudes to allow increased opportunities for shellfish aquaculture that would improve water quality, especially helping reduce difficult to manage non-point sources, and stimulate local economies.
References
Bouraoui F, et al. (2011) Long term nutrient loads entering European seas, EUR 24726 EN, Publications Office of the European Union, Luxembourg, 2011, ISBN 978-92-79-19319-4, doi:10.2788/54513, JRC 62873. 82 pp.
Bricker SB, et al. (2018) The role of shellfish aquaculture in reduction of eutrophication in an urban estuary. Environmental Science & Technology 52 (1): 173– 183.
Cornwell J, et al. (2016) Panel recommendations on the oyster BMP nutrient and suspended sediment reduction effectiveness determination decision framework and nitrogen and phosphorus assimilation in oyster tissue reduction effectiveness for oyster aquaculture practices. Report to the Chesapeake Bay Program. http://www.chesapeakebay.net/documents/Oyster_BMP_1st_Report_Final_Approved_2016-12-19.pdf. Accessed 4 Jan 2021.
Eurostat. (2020). Eurostat. Retrieved 12 October 2020, from https://ec.europa.eu/eurostat/data/database. Accessed January 2021.
Ferreira, JG & SB Bricker. 2016. Goods and services of extensive aquaculture: shellfish culture and nutrient trading. Aquacult. Int. 24:803–825.
HELCOM (2015) Updated Fifth Baltic Sea pollution load compilation (PLC-5.5). Baltic Sea Env. Proceedings No. 145.
HELCOM (2018) Sources and pathways of nutrients to the Baltic Sea. Baltic Sea Env. Proceedings No. 153.
Longline Environment Ltd. (2020). META - Maritime and Environmental Thresholds for Aquaculture. Retrieved 12 March 2021, from www.longline.co.uk/meta.
OSPAR (2017) Eutrophication Status of the OSPAR Maritime Area. OSPAR Commission, London, OSPAR publication no. 694/2017, ISBN: 978-1-911458-34-0, 166 pp.
Skarbøvik E, et al. (2013) Riverine inputs and direct discharges to Norwegian coastal waters – 2012, Norwegian Institute for Water Research Report No. M-80/2013, ISBN 978-82-577-6319-0.