MULTIDIMENSIONAL AQUACULTURE INVESTOR INDEX: BLACK SEA RIPARIAN COUNTRIES
Introduction
The demand for fish products in Black Sea riparian countries has been intensively growing annually by 4% since 2000. This demand was predominantly covered by importation and/or capture fisheries. To reduce pressure on the wild fish stocks of the shared sea basin, regional and national development plans are aiming to stimulate aquaculture production. However, there is a scarcity of instruments that allow assessment of the situation on the regional level to capture the multidimensional nature of such activity. A Composite Indicator or so-called Index has been recognized as one of the best ways to investigate the complex system statement and reveal areas of concern. T his study was aiming to investigate whether some indicators have greater impact on industry development. Furthermore, the index can be used by investors as a quick guide to fish farming bottlenecks and strengths of each country in the Black Sea region and facilitate investments to the industry.
Materials and Methods
The Index was constructed on the basis of best practices carefully selected by the joint collaboration of Organisation for Economic Co-operation and Development and Joint Research Centre (OECD, 2008). The conceptual foundation of the current research was drawn from the Horizon 2020 Aquaspace project deliverable D2.4: Smartphone ‘Investor Appeal’ application (Ferreira, et al., 2017; Ferreira, et al., 2020) with region-specific adjustments and improvements suggested by the authors. All indicators and analytical methods were selected considering the nature of the data in the given region. Moreover, 20 experts were invited to participate to the selection and validation of indicators. In addition to that, they were asked to assign weights to each indicator. Principle Component Analysis were also used for weights allocation as a counterweight for comparison of two methods. Finally, with the help of innovative approach all final indicators were tested for correlation with the main output variable such as aquaculture production per capita. This approach helped to equalize all countries in terms of production capacity and to see if some indicators have greater correlation with higher production performance among countries.
Results
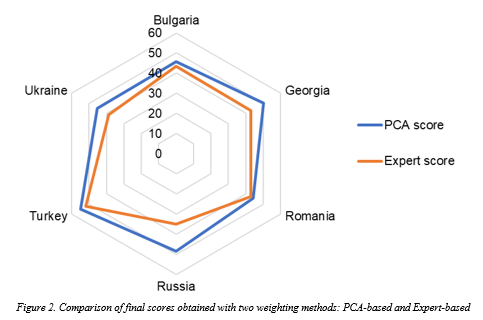
Final scores with expert-based weighting were not largely different from PCA weighting . The main difference was observed only for Russian scores due to the low involvement level of aquaculture experts (Fig.1). It is also interesting to notice in some disparities of scores , that all experts were more concerned by the governance factors, while unbiased PCA method assigned higher scores to some market indicators which were largely underestimated by the experts. It was concluded , that further research should include experts from the market sector.
Overall market- related factors appea red to be more influencing in aquaculture development for all countries in the region (Fig.2). Environmental and Production sectors were less influencing than Market dimension; Governance and Social dimensions had the smallest impact on fish farming development in the Black Sea region.
Discussion
Multidimensional aquaculture investor index has demonstrated to be an effective method to capture the level of importance of aquaculture-relevant indicators to build successful governance strategy and to assist investors. Due to the time restrictions of the project, some indicators data couldn’t be collected on time. Though, indicative results were obtained even with the reduced list of indicators. Further research with complete list of indicators will provide greater insight to the aquaculture landscape in the region and give more additional highly-influencing factors for policymakers.
References
O ECD, 2008. Handbook on Constructing Composite Indicators. s.l.:OECD Publishing.
Ferreira, R. et al., 2017. EU Horizon 2020 project grant no. 633476, Deliverable D2.4, Smartphone ‘Investor Appeal’ application. s.l.:s.n.
Ferreira, R. G. et al., 2020. A multimetric investor index for aquaculture: Application to the European Union and Norway. Aquaculture, 516(1).