SINGLE CELL TRANSCRIPTIONAL PROFILING OF GILTHEAD SEABREAM Sparus aurata GILLS: A USEFUL TOOL FOR MONITORING GILL HEALTH IN AQUACULTURE
Introduction
Teleost gill is a complex multifunctional organ essential for several physiological functions, such as gaseous exchange, osmoregulation, excretion of nitrogenous waste, pH regulation, immunity, and hormone production . Gill health is a key aspect in aquaculture and, due to the direct contact with the environment, it can be affected by different factors such as pathogens or environmental stressors.
Our current knowledge on the gill transcriptional responses in gilthead seabream is based on bulk transcr iptomics of whole tissue, making it difficult, if not impossible, to link a response to a specific cell type or structure. In this work, we performed a single cell RNA-sequencing study to obtain a transcriptional atlas at single cell resolution that allowed us to define different cell types and subtypes in the healthy gill and find marker genes that can be used for monitoring gill health in aquaculture.
Material and Methods
Two healthy gilthead seabream of 100 g were euthanized and bled completely to avoid erythrocyte contamination. Left gill arches were extracted and single cell suspension of gill filaments were obtained using a protocol based on incubation with EDTA, DTT, DNaseI and collagenase, and mechanical dissociation. Single cell suspensions were fixed with the Parse Biosciences Fixation Kit and 8, 300 fixed cells were subjected to combinatorial barcoding and library preparation using the Evercode WT v3 kit .
After Illumina sequencing, quality filtering and data analysis was performed using Trailmaker . Mapping was performed using fSpaAur1.2 genome assembly from NCBI . Seurat was used for c lustering and differential expression analysis. Marker genes for each cell cluster were used to perform gene ontology (GO) analyses and identify cell types.
Results
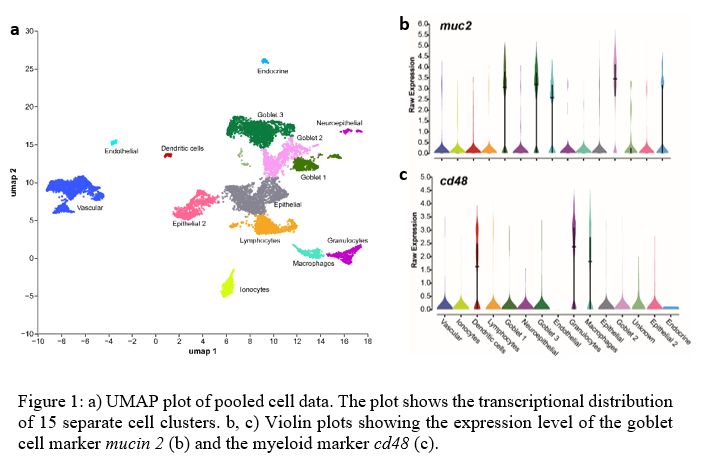
After quality filtering, 3,000 cells per sample, with a median of 550 genes per cell were obtained. Cells were clustered into 15 groups that were broadly annotated by the differential expression of marker genes and enriched GO terms (Fig. 1a).
The largest clusters corresponded to epithelial, vascular and goblet cells , the latest with high expression of mucin 5ac and mucin 2 (Fig. 1b), and markers involved in epithelial cell differentiation and mucus layer. Epithelial cells expressed markers involved in cell junction and adhesion, desmo some or extracellular matrix organization (e.g. collagens, claudins or plakophilin s). Transcriptional markers in the vascular cell cluster belonged to GO terms like collagen binding, cell adhesion, circulatory system, etc. Further subclustering of the vascular cell cluster allowed to identify the pavement cell population.
The expression of markers like chga or notch1 allowed the classification of endocrine and neuroepithelial cells, respectively. Endothelial cells were enriched in markers involved in GO pathways related to the establishment of the endothelial barrier, such as ppp1r16b , tjp2 , krt19 and cdh5 . A clearly separated cluster, with marker genes enriched for GO terms like ion transport was identified as ionocytes or mitochondrion-r ich cells (MRCs), important cells in maintaining osmotic, ionic, and acid-base levels.
Regarding the immune system, three clusters were identified as myeloid cells by the expression, among others, of the cell markers cd74 and cd48 (Fig. 1c), and then further labeled as dendritic cells, macrophages and granulocytes. The lymphocyte population contained markers for both, B and T lymphocytes, such as trbc , trac , cd40 and pax5.
Conclusions
This work provides the first transcriptional atlas at single cell resolution of the healthy gilthead seabream gill. We had broadly described 15 different populations based on marker gene expression and GO analysis. Further subclustering of the largest populations will provide markers and the transcriptional profiles for cell subtypes.
This dataset sets the baseline expression in healthy gills and provides a set of markers that will ease the interpretation of future studies aimed to determine gill status under different situations, pathogens or stressors.
Funding
This work was supported by the project LinfoBream (CNS2022-135433, NextGenerationEU, PRTR ) funded by the Spanish Ministry of Science and Innovation (MCIN/AEI/10.13039/501100011033).