BLUE MUSSELS: SINNERS OR SAINTS? GREENHOUSE GAS EMISSIONS FROM SHELL FORMATION IN THE NORTH ATLANTIC
Introduction
Farmed blue mussels (Mytilus edulis ) are one of the animal-source foods with the lowest greenhouse gas emissions associated with their production, i .e. from material and energy use in spat collection to grow-out production (Gephart et al. 2021), mainly related to their independence from manufactured feeds. F eed often comprises the lion’s share of farmgate emissions of farmed seafood (Bohnes et al. 2019). However, it has been suggested that the carbon dioxide released into the ocean during the calcification process of shells makes a non-trivial contribution to farmgate greenhouse gas emissions and excluding it may lead to an underestimat ion of total emissions (Ray et al. 2018). The M ussel Puzzle is a three-year project aiming to quantify the environmental impacts of different mussel production technologies across various locations using Life Cycle Assessment (LCA) while also assessing the potential for industry expansion and its related environmental trade-offs. Here, we quantify the carbon dioxide released over time from shell calcification in major mussel production areas in the North Atlantic.
Methods
Carbon dioxide emissions from shell formation were calculated using the formula :
CO₂ Emissions = 𝜓 × Shell Mass × Percent CaCO₃ × Molecular Ratio
To do this, t he buffering capacity (ψ) of seawater was calculated using the psi function within the seacarb package in R (Gattuso et al. 2024). This function estimates the seawater’s buffering capacity under specified conditions . The 𝜓 calculation requires location-specific data on sea surface temperature, salinity, pH and the surface partial pressure of carbon dioxide in seawater (spCO2). These data points were extracted from satellite data provided by the EU’s Copernicus program . Carbon dioxide emissions from shell formation were then calculated on a monthly basis for the major mussel production countries in the North Atlantic , based on FAO production databases for the three most recent years available (2022 - 2024). Spain, as the most important European mussel producer, was included, although the main species produced is M. galloproviancialis rather than M.edulis .
Results
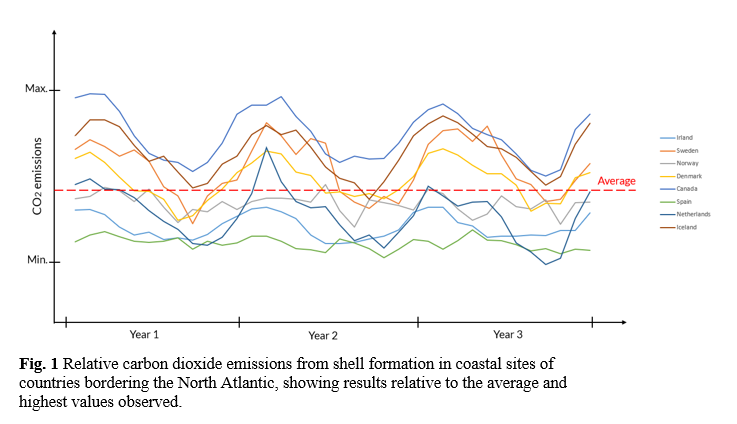
Results show considerable variability in CO2 emissions from shell formation across different sites, with Canada having the highest average emissions and Spain the lowest (Fig. 1). Emissions seem to be largely temperature-driven , as the ranking closely follows latitude. In particular, the northern latitudes show considerable seasonal variability, with higher emissions in the winter and lower in the summer , while seasonal variability in the southern latitudes is much smaller .
Discussion
We show considerable variability in shell formation emissions across farming regions . In particular, northern latitudes show considerable temporal variation in emissions between summer and winter. It is important to note that not all of these emissions will reach the atmosphere and contribute to global warming, but it is difficult to determine exactly how much will. In our presentation, we will discuss this and relate the greenhouse gas emissions from shell formation to those generated by production processes, which have typically been included in greenhouse gas emission estimates. Whether mussels are sinners or saints, i.e. sources or sin ks of carbon, also depends on what happens with shells after harvest and the time horizon in the assessment. We will discuss how to incorporate these findings into future greenhouse gas emissions accounting for farmed mussels.
References
Bohnes, F.A., Hauschild, M.Z., Schlundt, J., Laurent, A., (2019) Life Cycle Assessments of aquaculture systems: A critical review of reported findings with recommendations for policy and system development. Reviews in Aquaculture (2019) 11:1061-1079
Gephart, J.A., Henriksson, P.J.G., Parker, R.W.R., Shepon, A., Gorospe, K.D., Bergman, K., Eshel, G., Golden, C.D., Halpern, B.S., Hornborg, S., Jonell, M., Metian, M, Mifflin, K., Newton, R., Tyedmers, P., Zhang, W., Ziegler, F., Troell, M. (2021) Environmental impacts of blue foods Nature 597:360-365
Gattuso, J.-P., Epitalon, J.-M., Lavigne, H., Orr, J., Gentili, B., Hagens, M., Hofmann, A., Mueller, J.-D., Proye, A., Rae, J., & Soetaert, K. (2024). *seacarb* (Version 3.3.3) https://CRAN.R-project.org/package=seacarb
Ray, N.E., O’Meara, T., Wil liamson, T., Izursa, J., & Kangas, P. (2018). Consideration of carbon dioxide release during shell production in LCA of bivalves. International Journal of Life Cycle Assessment, 23 (5), 1042-1048.