FISH-FARM PRODUCTIVITY AND SUPER-SITES IN SALMON FARMING IN NORWAY
The value of “Super-sites”
Salmon farmers in Norway talk about “super-sites”, for sites that are especially suited for grow-out of salmon, and which have especially high productivity. High productivity can however be measured in different ways, and there may be different types of qualities and effects that can make an area a “super-site”. The productivity can e.g. be measured in terms of the total average volume produced to slaughter per year, the effective economic feed factor, or in pecuniary terms (low production costs or high profitability).
Factors that describe and explain competitiveness between salmon producing nations include growth rates, feed conversion ratio, harvest weight, smolt yield and mortality for the farmed fish (Iversen, Asche, Hermansen, & Nystøyl, 2020). The same factors may explain what makes a site a super-site. In addition, the prevalence of lice, disease and external shocks like algae blooms and string jellyfish may strongly affect productivity and profitability.
While some literature find that biophysical factors does not explain profitability (Zhang, Sogn-Grundvåg, He, Tveteras, & Xu, 2025), this is probably because they fail to recognize the great variation among sites. Measuring productivity at firm level (some firms holding up to 300 sites) you effectively cancel out the variation between sites in terms of temperature, growth, lice prevalence, mortality et.c. Analyzing productivity at the site-level (using data on pen level to improve data on growth and feed conversion ratios) will give a significant contribution to the literature on biophysical factors and productivity.
Under the newly proposed production regulation regime in Norway, the productivity of aquaculture sites will be of increased importance, as the productivity of the site will be a strong determinant of company value.
This presentation
We will present an analysis that identify actual super-sites in Norwegian grow-out salmon farming. These will be based on different criteria and criteria-sets for what defines a super-site. The simplest measure is its revealed capacity to produce over time.
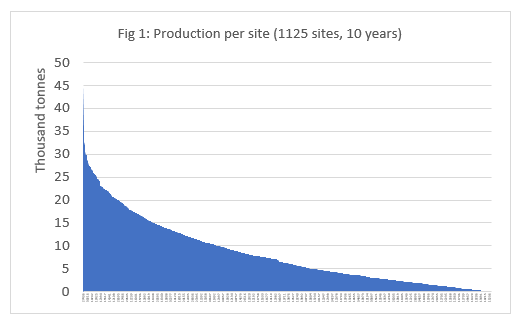
The production capacity of the site as defined by the aquaculture license (which is in terms of the maximum biomass in tonnes that can be held at the site at any given time), but real production capacity varies much more than licensed capacity, dependent on depth, currents, how long fallowing periods are needed between generations to restore sea bottom conditions, average lice numbers on the salmon in the farm and the need for lice treatments to stay within the mandatory limits, disease outbreaks et.c. Revealed capacity is illustrated in figure 1 (each site on the x-axis). This shows the combined production for each site over the last ten years. Production ranges from close to 45.000 tonnes, or 9000 tonnes over each two-year production cycle. Only 1/3 of the sites have shown a production of more than 10.000 tonnes for these ten years.
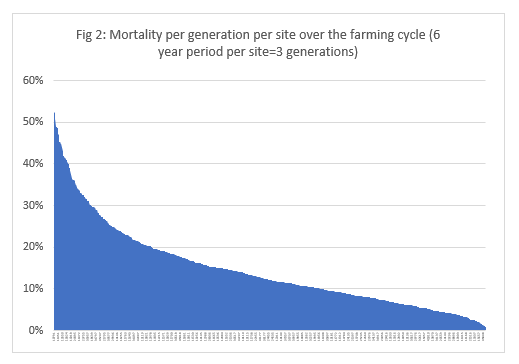
The analysis will describe the distribution of growth rates, mortality, feed conversion ratio, smolt yield et.c., and analyze how these parameters are explained by temperature, lice prevalence et.c. Even for these factors variation is huge, as exemplified by mortality in figure 2. Mortality ranges from over 50 % down to 1-2 % for the best sites.
The analysis will also include how different operational characteristics and parameters for individual farms as well as groups of adjacent farms may help explain the variation in performance and what makes a site a super-locality. The analysis is based on a dataset with production data from all individual pens in Norway for the period 2005-2024. This is combined with data on lice prevalence, lice treatments and disease. The huge range of productivity between sites will be translated into economic effect by a techno-economic model as used in (Holan et al., 2017; Iversen, Hermansen, Nystøyl, & Hess, 2017).