BREED ABOVE THE CURVE: QUANTITATIVE GENETICS FOR SHAPE-RELATED TRAITS USING IMAGE ANALYSIS IN GILTHEAD SEABREAM Sparus aurata
Introduction
Body shape is a critical trait in aquaculture breeding and management , as it influences both the biological performance and the market value of fish. Body shape can vary considerably due to environmental conditions , and can be influenced by artificial selection. Shape can therefore serve as an indicator to study environmental adaptation of certain species. For species that are marketed as whole, shape is particularly important as it influences consumers’ preference and the perceived quality of the product (Colihueque & Araneda, 2014).
However, the definition and quantification of body shape remains complex. Shape is not a single trait but a collective expression of various morphological attributes. In flatfish such as sole, shape can often be approximated with simple geometric measurements such as fitting an ellipse. For finfish such as gilthead seabream, shape quantification becomes more challenging and typically relies on multiple indicators derived from landmarks, rati os or manually annotated traits (Fragkoulis et al. , 2021). These indicators might exhibit low genetic correlation with the shape outline and are not favoured by breeders for indirect selection.
Besides quantitative measurements , shape is also assessed in breeding programs through expert grading, where visual scores are assigned based on pre-defined criteria. While this method reflects practical and market driven evaluations, it might suffer from subjectivity and low resolution (Blonk et al., 2010) , restricting the coefficient of variation available for selection.
To overcome these limitations, we propose an analytical pipeline for automated quantitative analysis of the body shape in gilthead seabream (Sparus aurata) . Based on the manual scores on selection candidates and their images, we defined a “Best” outline and a “Worst” outline and subsequently de rived two novel traits for selection candidates: Distance to the Best (DtB) and Distance to the Worst (DtW) . These traits quantify how closely each individual resembles the most, or least, desirable shape . Furthermore, we demonstrate that both traits exhibit genetic variance and can be integrated into breeding programs for shape improvement.
Materials
Images were collected in 10 batches at harvest from 3,421 gilthead seabream ( Sparus aurata), all of which were breeding candidates with known pedigree information. Each fish was visually scored on five morphological traits: head, ventral side, peduncle fin, caudal peduncle, and caudal side. Scores ranged from 1 to 3, with a score of 3 indicating the ideal condition for each trait.
Methods
For each image the fish was segmented from the background using the Segment Anything Model (SAM). Contour detection was then performed using OpenCV, and Elliptic Fourier Descriptors (EFD) were applied to mathematically transform the extracted contours. Each contour was reconstructed using seven harmonics of the EFD, producing a smooth outline with 1,000 key points.
The reconstructed contours were standardized in orientation using Principal Component Analysis (PCA), aligning them according to their first and second principal components. To ensure consistency, all key points on the contours were re-indexed starting from the anterior tip and proceeding clockwise.
An average contour was generated via Procrustes analysis using only the fish that received a score of 3 for all traits. The Procrustes distance from each individual’s contour to this average was calculated and defined as a new trait: Distance to the Best (DtB) . The same process was repeated using contours from fish that received a score of 1 for all traits, producing a second trait: Distance to the Worst (DtW). All image processing and distance calculations were conducted in Python 3.9.
Heritability estimates for DtB and DtW were obtained using a univariate animal model, and their genetic correlations with the original visual scores were calculated using a bivariate model. All genetic analyses were performed using ASReml-R.
Results
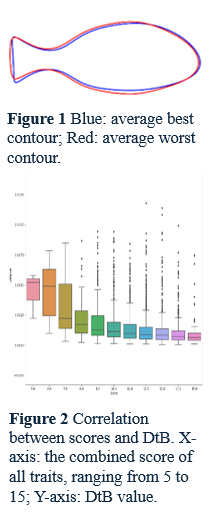
Figure 1 illustrates the average contours for the best-scoring and worst-scoring fish. The heritability estimates were 0.39 ± 0.04 for DtB and 0.27 ± 0.03 for DtW.
We evaluated the agreement between DtB and the original visual scores, with a particular focus on DtB . As shown in Figure 2, there was a general negative correlation between DtB and the manual scores, with a significant Pearson correlation of -0.12, indicating that higher-scoring fish tended to be closer to the ideal contour , with a smaller DtB value.
Genetic correlations of DtB and DtW with the original trait scores ranged from low to moderate. For example, the dorsal side score showed near-zero genetic correlation with both DtB and DtW , suggesting limited variance or low consistency in the manual grading for this region. In contrast, the ventral side score exhibited moderate genetic correlations: -0.36 ± 0.08 with DtB and 0.27 ± 0.03 with DtW , indicating greater phenotypic and genetic variance in that area. This trend is visually supported by the contour plots in Figure 1, where the greatest divergence between best and worst shapes occurs along the ventral region. In comparison, the dorsal contours appear more aligned and parallel, suggesting lower shape variance and scoring sensitivity in that region.
Reference
Blonk, R. J. W., Komen, J., Tenghe , A., Kamstra, A., & van Arendonk, J. A. M. (2010). Heritability of shape in common sole, Solea solea , estimated from image analysis data. Aquaculture, 307(1–2), 6–11.
Colihueque , N., & Araneda, C. (2014). Appearance traits in fish farming: progress from classical genetics to genomics, providing insight into current and potential genetic improvement. Frontiers in Genetics, 5, 251.
Fragkoulis, S., Kerasovitis , D., Batargias , C., & Koumoundouros, G. (2021). Body-shape trajectories and their genetic variance component in Gilthead seabream ( Sparus aurata L.). Scientific Reports, 11, 16964.